Information is the lifeblood of many businesses today. Organizations want to know details of their social media engagement, their website traffic and lead generation, their production status, support ticket statistics, stock price, there are an almost limitless number of data points vital to business success.
In order to ensure key players in the company, or sometimes everyone in the company, are aware of information, organizations use dashboards to gather key statistics and data points from a variety of sources. Visualization and understanding of key metrics can help companies improve their business.
Using dashboards to organize your data
Dashboards provide at-a-glance views of KPIs (key performance indicators) relevant to a particular objective or business process (e.g. sales, marketing, human resources, or production). The data in a dashboard is usually organized into graphs, charts or maps with key metrics based on time of the day, day of the week or even stretching across the years. A dashboard allows staff to quickly pull the data they need, and filter it by any criteria they need, focusing only on the relevant data.
While many organizations understand the value of dashboards, companies are still asking themselves how best to use them, how to keep stakeholders aware of vital the vital information in various dashboards without swamping them in data. Companies want to give access to information when and as needed.
But how to see your dashboards at once?
To anyone attempting to track all the variables relevant to their company, it will quickly become clear there’s a huge amount of information and a large number of dashboards to deal with. For example, an online marketplace company will want to track their site’s availability, purchase activity, user/member growth, geographic location of sales. But they’ll also want to track advertising and marketing campaigns, social media mentions and shares. They’ll need to track their support tickets and their warehouse inventory, shipping dates, others in the company will be tracking revenue, forecasts, stock price.
For anyone in the company who needs to know just one of these things, managing that information is easy but for those that need to keep track of many of them or even all of them, they need an approach that allows for quick and easy visualization and decision making.
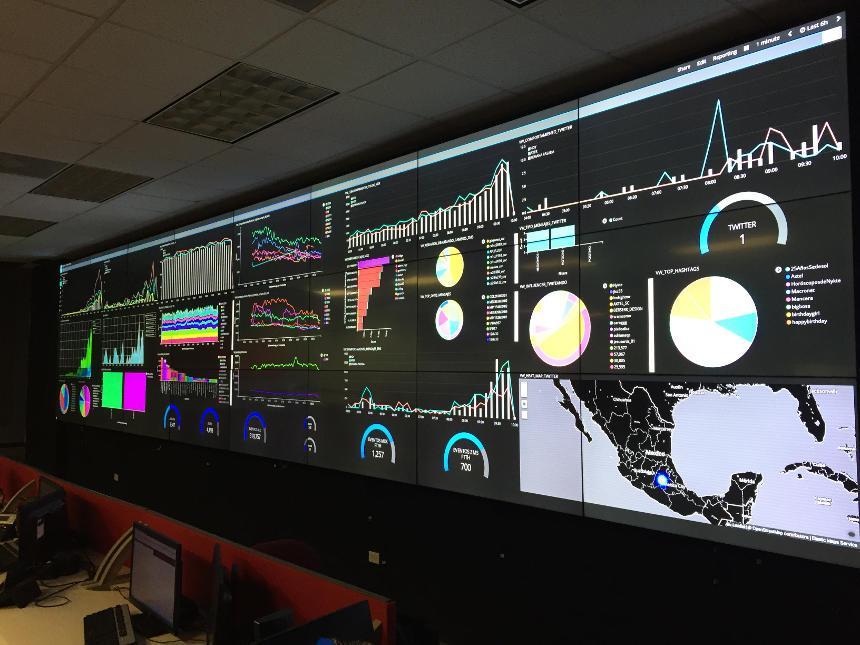
Video walls to view them all
This is where video walls come into play. A video wall can provide the real estate, the power and the flexibility to display multiple dashboards simultaneously, enabling individuals or small groups to keep an eye on multiple metrics and dashboards when and as needed. They allow for collaboration among team members and ensure everyone is on the same page.
The right video wall controller allows you to display multiple input sources, with different content sources on different zones. A video wall controller will also allow you to quickly change what’s shown on each zone or put one piece of content across all the screens for a larger view of one particular dashboard.
What’s more, a good video wall controller will allow you to manage and display content on not only the video wall, but also on independent displays. So for example, a company can have a video wall in an executive meeting room to showcase dashboards of interest to the management team but then have individual screens, or smaller video walls at different team sites across the office or across multiple offices with dashboards relevant only to each specific team.
The right solution to visualize your dashboards
This is exactly what Userful does. It’s a powerful video wall controller that is easy to use for those that want to display multiple sources of information across multiple displays or video walls and centrally control them.
Userful turns a standard PC into a high-performance video wall controller or video wall processor. It uses the network to connect to displays, which facilitates the deployment of video walls and individual displays across a large office, and ensures ease of use and set up and a cost-effective price point.
Userful allows you to have as many multiple independent web browsers as the PC running your video wall can handle and they can be displayed simultaneously on multiple zones on your video wall. (The video wall image can be split in just about any way you want using Userful’s multi window feature)
The solution supports a wide range of input sources (RTP and RTSP, local content through HDMI or SDI capture etc). Because of this flexibility, it’s ideal for gathering data and display it on dashboards. There’s just about no content you can’t put on a video wall and Userful makes it easy to switch the content you’re displaying on the fly or interact with it controlling the mouse and keyboard from your own desktop.
Userful’s browser-based control allows central management of multiple video walls, even across multiple sites. This means if executives want to ensure all sites are aware of the same information, they can push out data and dashboards to displays across the enterprise, to any site worldwide.
In the age of information overflow, being able to capture data as it happens, simplifies things and help teams focus on set goals. Video walls just offer the ideal platform to visualize as many data sources dashboards as once, and Userful makes it simple and cost-effective to deploy and operate whether it’s across an enterprise or for a small business.
Visit here to read more about Userful’s powerful video wall controller solution.
Userful
Powering Mission Critical Enterprise Operations & Security Worldwide